Inflation is here, it’s persistent and it’s causing real problems for many Americans. It may be some comfort to know that what we’re experiencing now is far from the hyperinflation that other countries have experienced in the last 80 years.
Our American history reveals a relatively mild but persistent experience with inflation. A visitor from Mars may well think that inflation was born in the 1970s, then had a long Rip Van Winkle-like 40-year nap, and now has awakened again. Not so.
According to tradingeconomics.com, the inflation rate in the United States averaged 3.28% from 1914 until 2022, reaching an all-time high of 23.7% in June of 1920. That means that the USD has lost about half its value every 21 years for over 100 years.
From the Bureau of Labor Statistics (keeper of the Consumer Price Index): “The World War I era and its aftermath, 1917–1920, then produced sustained inflation unmatched in the nation anytime since. Prices rose at an 18.5-percent annualized rate from December 1916 to June 1920, increasing more than 80 percent during that period.”
There is usually an agreed-upon reason for spikes in inflation. The high inflation of the World War I period and its aftermath was blamed on the release of economic controls imposed during the war. Pent-up demand led to a race to buy formerly rationed goods, and businesses quickly raised the prices on items they’d been forced to keep low.
World War I was a long time ago, and even the ’70s were over four decades ago. 40 years is a long time, roughly half a human lifetime, and two-thirds of the time we spend as adults. But 40 years is well within the living memory of many Americans, and many if not most of those reading this Chronicle.
Inflation — Last Time
Periods of sustained inflation have not been kind to US Presidents. Jimmy Carter’s administration is virtually synonymous with inflation, and introduced some terms of art (which today we’d call memes) that we might be better off without:
- Stagflation is defined as persistent high inflation combined with high unemployment and stagnant demand in a country’s economy.
- The Misery Index, coined by economist Arthur Okun, is meant to measure the degree of economic distress felt by everyday people, due to the risk of (or actual) joblessness combined with an increasing cost of living. The misery index is calculated by adding the seasonally adjusted unemployment rate to the inflation rate.
- Malaise Era, The term “malaise era,” coined by journalist Murilee Martin, refers to U.S. President Jimmy Carter’s “Malaise Speech” in which he discussed America’s failure to deal with the 1979 oil crisis.
Like all presidents before and after him, Carter wanted the job, and inflation predated his election in 1976 over Gerald Ford. Ford had his own battles with inflation, most famously captured by his “Whip Inflation Now,”or WIN campaign, featuring lapel buttons.
Ford, in turn, inherited inflation from Richard Nixon, whose biggest problems with inflation began with the 1973 OPEC oil embargo and its resulting fuel shortages and crude prices doubling and then doubling again in a four-month period.
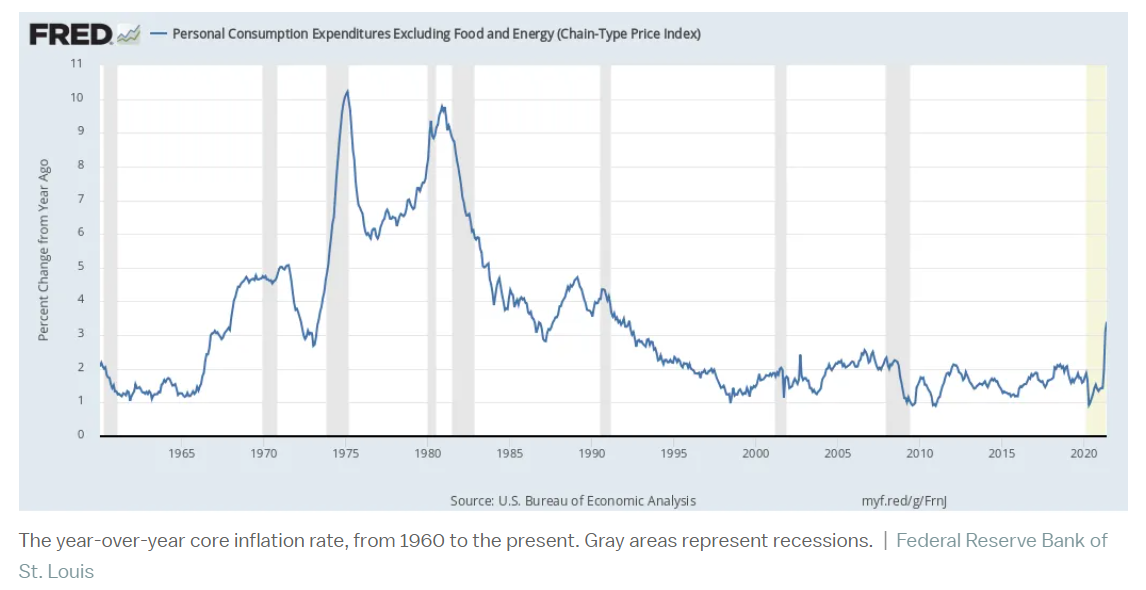
As you can see from the chart below, inflation in the 70s era got its start in the mid ’60s, and was problematically high from 1974 to 1982 when it began its long decline and two-decades long period of stability, which finally ended with COVID-19’s supply chain disruptions. Note, also, the number of recessions that occurred during this period, and how they tend to cluster near periods of high or rising inflation.
The Volcker Shock
Paul Volcker was named Fed Chairman in August of 1979 and came into office with a radical agenda to put inflation down once and for all. His concept was simple: crush consumer demand (and therefore prices) with high-interest rates.
In October of 1979, the Fed’s interest rate was 13.7%; by April of 1980 it was 17.6% and it would be near 20% several times in 1981. Mortgage, credit card, and business loan interest soared. It worked; demand slowed, and inflation eased, but the country entered a deep recession.
In fact, there were two “Volcker Shock” recessions. In 1980, unemployment reached 7.8% and in late 1982, it peaked at 10.8%, higher than even the Great Recession of 2009. Interestingly, US unemployment hit a 50-year low in July of this year, at 3.5% and there were 10.1 million job openings on the last day of August.
These job numbers suggest there may be some justification for the Biden administration’s claim that we are not in a recession now, despite the most recent two-quarters of negative GDP growth, the generally accepted definition of a recession.
The Fed is following the Volcker method — sort of. It has raised rates four times in 2022, by a total of 2.25%, but because the rate was zero during COVID, it is only at 2.5% today, a long way from the near 20% rate of 1981.
Control the Controllables
We simply cannot predict what will happen with interest rates or inflation. We can’t know how high rates will have to rise to hit the Fed’s CPI target of 2%, and we have no way of knowing if inflation has peaked or may yet go higher. If history is our guide, however, it’s reasonable to expect that rates will continue to rise for some time, and, along with higher prices across the board, will likely have an impact on demand for big-ticket items like houses and automobiles.
What might this mean for your portfolio? Forbes Advisor had this to say two months ago:
“After the December 1974 inflation peak of 12.2%, the S&P 500 gained about a 37% annual return, after posting around a 26% loss the prior year, according to data from the NYU Stern School of Business on Historical Returns on Stocks, Bonds, and Bills: 1928-2021.“
When inflation peaked in early 1980 at nearly 14%, the S&P rose again, gaining more than 30%, historical data shows. So investors certainly want to know when the tide will turn but calling the peak will be a challenge.
It’s informative to check the historical record once again, in this case by looking at the inflation-adjusted S&P 500 over a very long period:
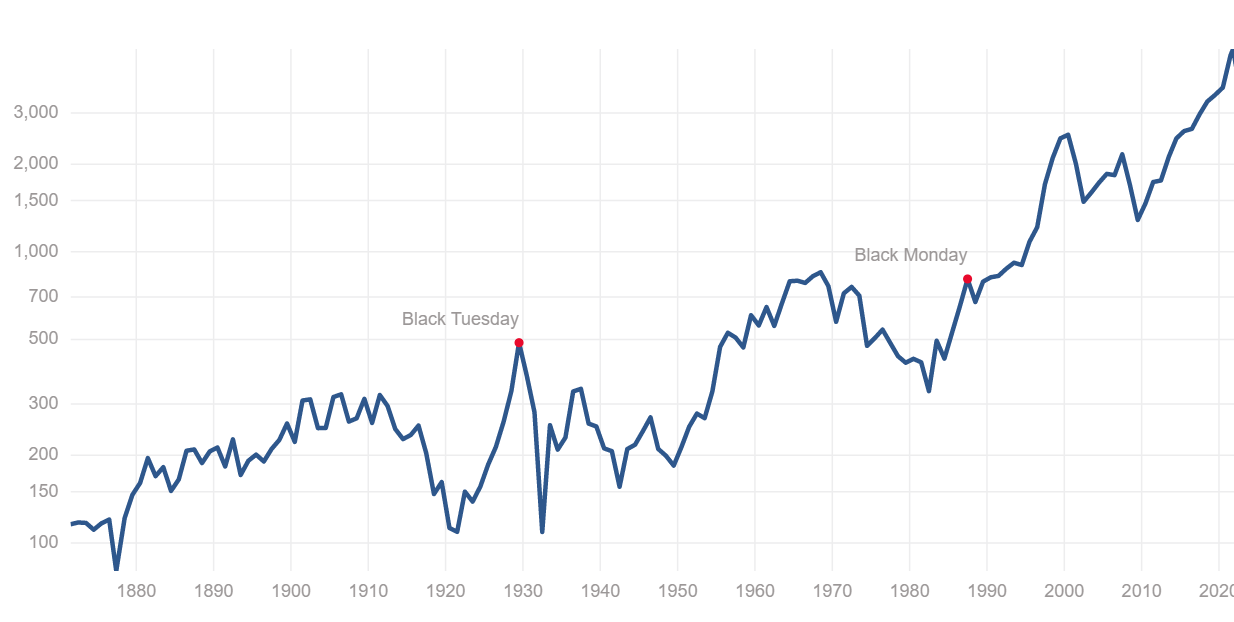
The period before the SEC Acts of 1933 and 1934 were obviously a time of wild speculation for stock investors, but you can see that since then the market has inexorably moved upward from its trough in 1933 — a 3,000% increase in 90 years — after inflation.
No one knew — although some guessed right — when any highs or lows occurred during those 90 years, and we submit that no one knows now. What we do know is that success in investing requires three things: a long-term orientation, patience, and discipline, three things that are, in fact, under your control.
Control, Part II
The S&P 500 is in a Bear period, and while that’s not fun for most people, it can be a good time to review your overall risk exposure. What is the maximum loss you can endure? If you don’t know that number, it might make sense to use our Real Risk Meter™, an interactive tool that can help you discover your loss tolerance.
If you’re looking for ways to economize during this time of inflation, it might make sense to analyze exactly how much you’re spending on financial services–asset protection and wealth management. We can help you with that, too, by accessing public sources like Morningstar and Personalfund.com. Many investors are spending much more than they realize, and that can have a negative impact on their financial security.
Are you sure that your portfolio of investments is as tax efficient as it could or should be? Our Taxes First, Then Math Analysis® can help with that, and can find ways to improve your after-tax results.
For any or all of these things, please book a little time with me and we can take you through the process. It’s not too late to make changes in 2022 that may improve your experience next April.